Project Overview
This project compares K-Means, Agglomerative Clustering, DBSCAN, and Self-Organizing Maps (SOM) across three datasets with very different structures: Mall Customers, Forest Type, and Human Activity Recognition (HAR). The goal is to understand how each method behaves under changing dimensionality, density patterns, and cluster geometry.
To make high-dimensional datasets more interpretable, the workflow applies Principal Component Analysis (PCA) for dimensionality reduction and visualization in 2D/3D spaces.
Principal Component Analysis (PCA)
PCA transforms potentially correlated variables into a smaller set of uncorrelated principal components ordered by explained variance. In practice, this enables faster experimentation, easier visualization, and often better cluster separability in downstream unsupervised learning.
Within this project, PCA is used as a preprocessing step for datasets such as Forest Type and HAR, where the raw feature space is high-dimensional and difficult to inspect directly.
Why PCA is useful in this project
- Reduces dimensionality while preserving most informative variance.
- Mitigates noisy or redundant directions in feature space.
- Enables 2D/3D visual inspection of clustering behavior.
- Improves computational efficiency for iterative clustering experiments.
Silhouette Score
Model selection and method comparison rely heavily on the Silhouette Score, which balances intra-cluster cohesion and inter-cluster separation using the coefficient (b - a) / max(a, b). Here, a is the mean distance to points in the same cluster and b is the mean distance to the nearest neighboring cluster.
By averaging this value over all points, the project obtains a global quality signal that helps compare methods and choose candidate hyperparameters.
Silhouette interpretation guide
- +1: point is well matched to its own cluster and far from others.
- 0: point lies near a boundary between clusters.
- <0: point may be assigned to the wrong cluster.
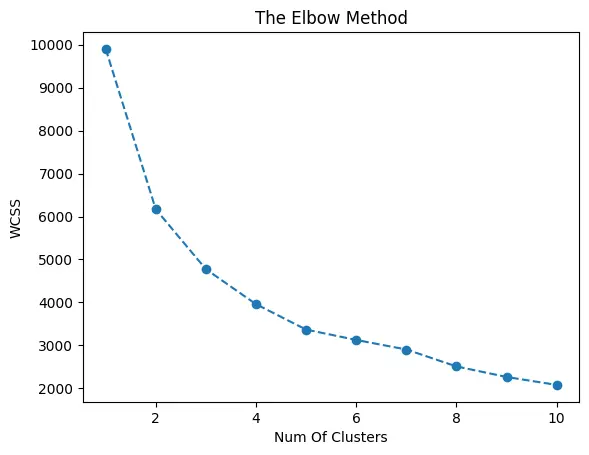
K-Means Clustering
K-Means iteratively assigns samples to the nearest centroid and updates centroids as cluster means. It is efficient and often strong when clusters are compact and roughly spherical.
In this project, the elbow method and silhouette values are used to guide k selection. Results show that K-Means remains one of the most stable and interpretable baselines, especially in Mall Customers and as a reference point for Forest Type.
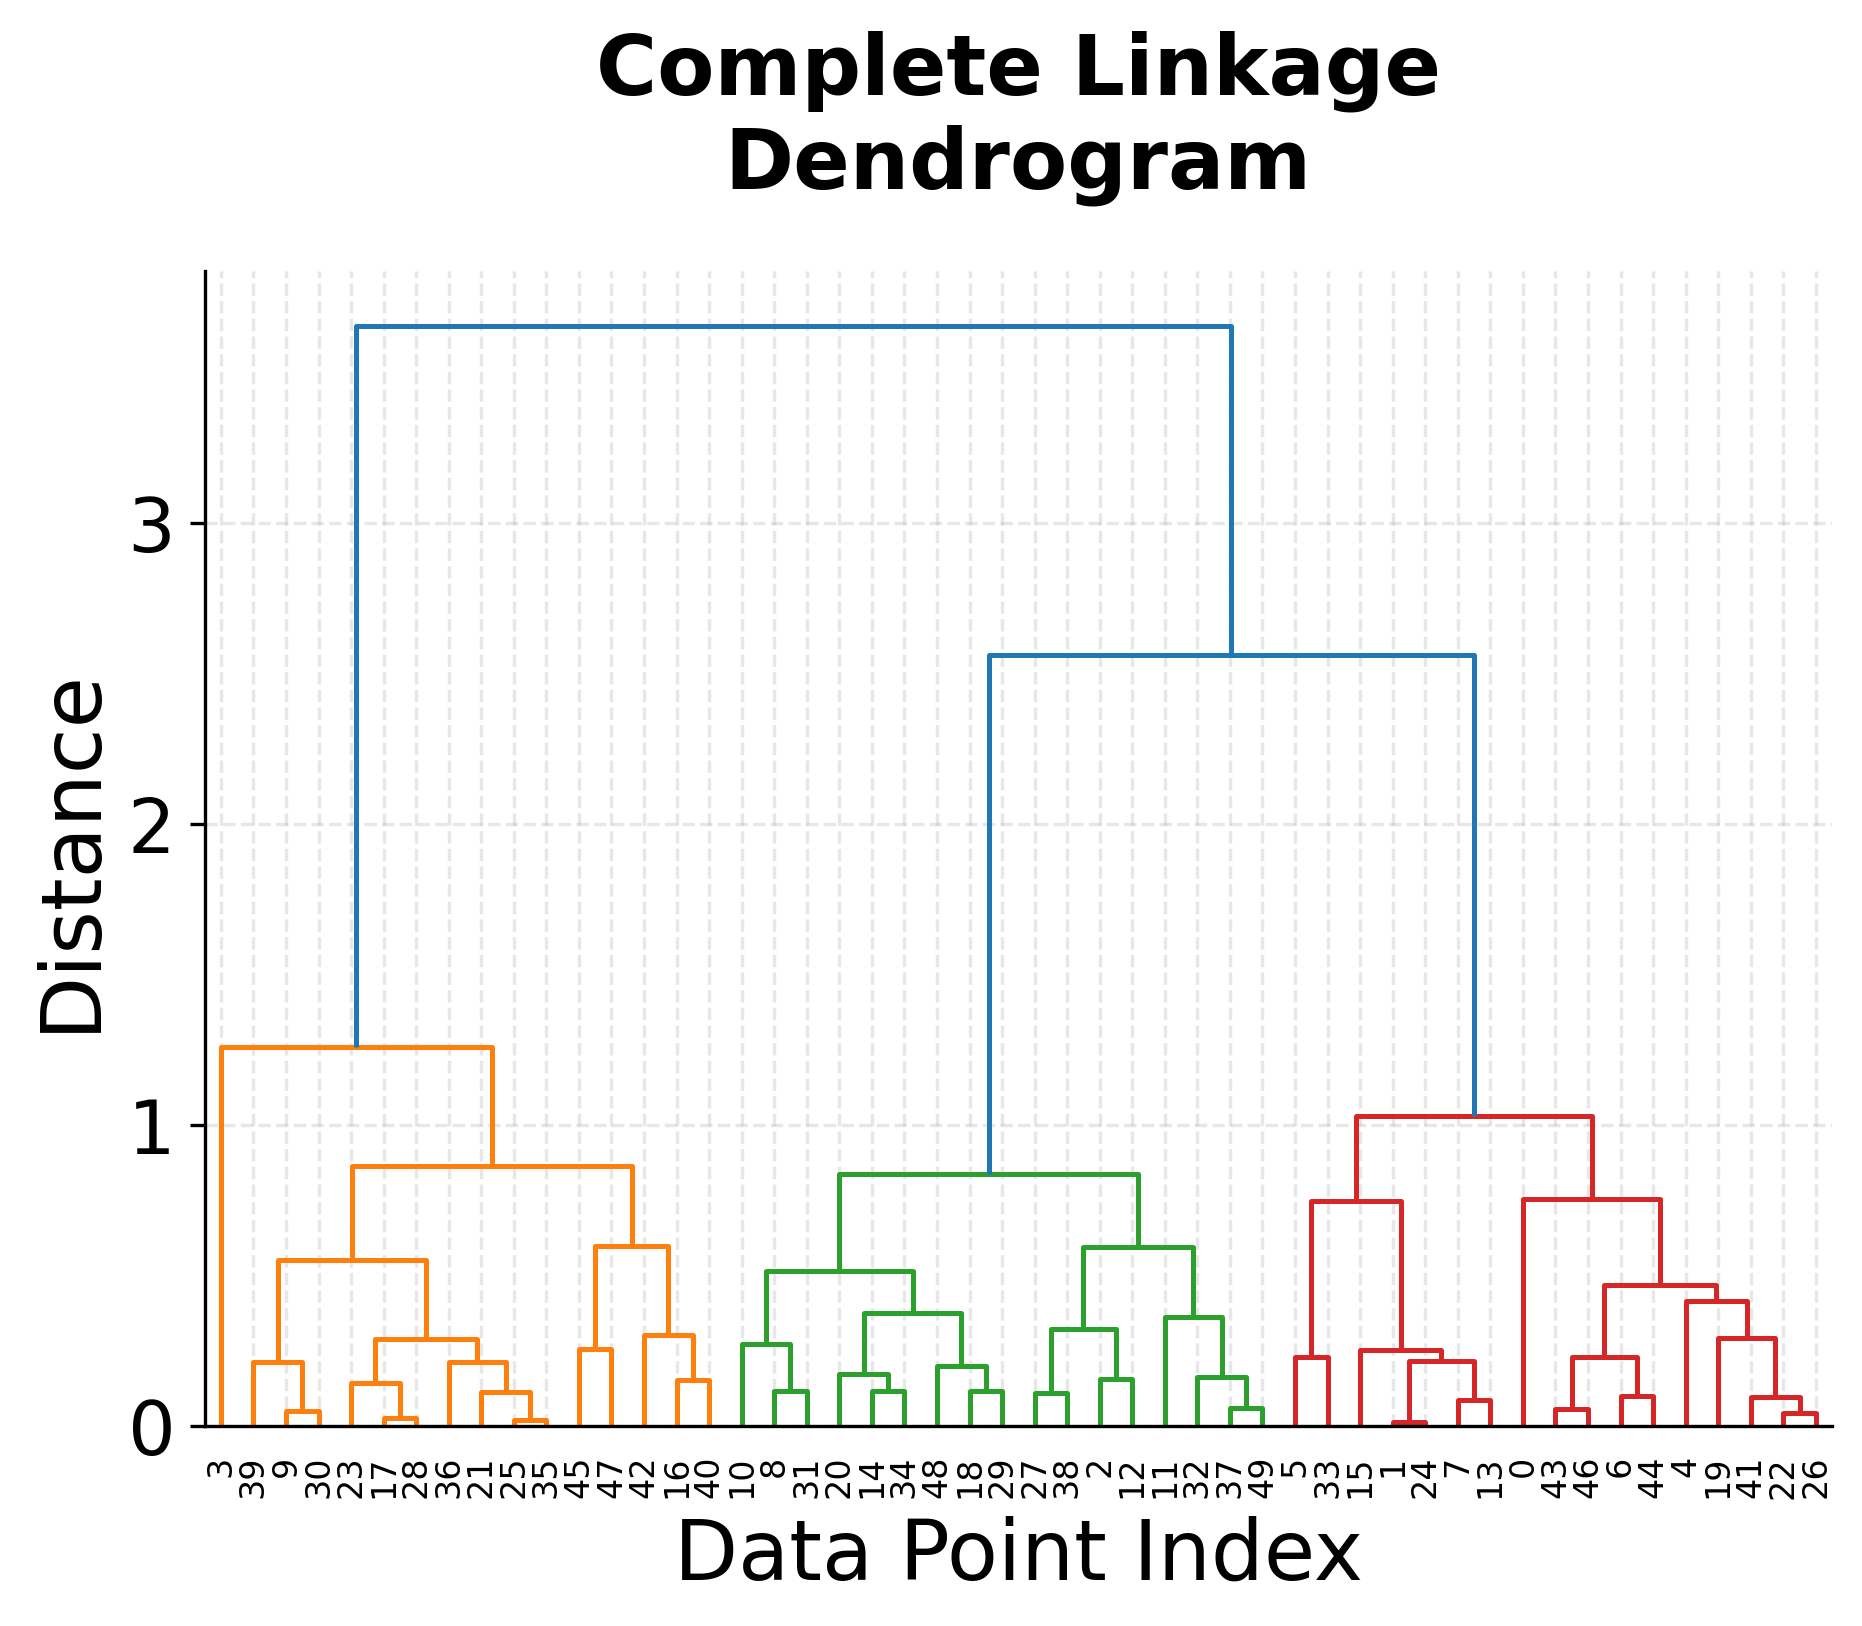
Agglomerative (Hierarchical) Clustering
Agglomerative clustering starts with one cluster per sample and merges clusters step by step. Different linkage criteria produce very different structures: Ward generally gives compact, balanced clusters; Single often suffers from chaining; Complete favors compactness; Average provides a middle ground.
Across experiments, Ward frequently offers the best trade-off between separability and interpretability.
DBSCAN
DBSCAN groups dense regions and marks low-density points as noise, avoiding a fixed number of clusters. It depends on eps and min_samples, and can work very well when cluster density is clearly structured.
In this project, DBSCAN shows mixed behavior: it can produce strong local results in some Mall configurations, but on datasets with more uniform density (e.g., Forest Type) it is harder to tune and less interpretable than K-Means or Ward.
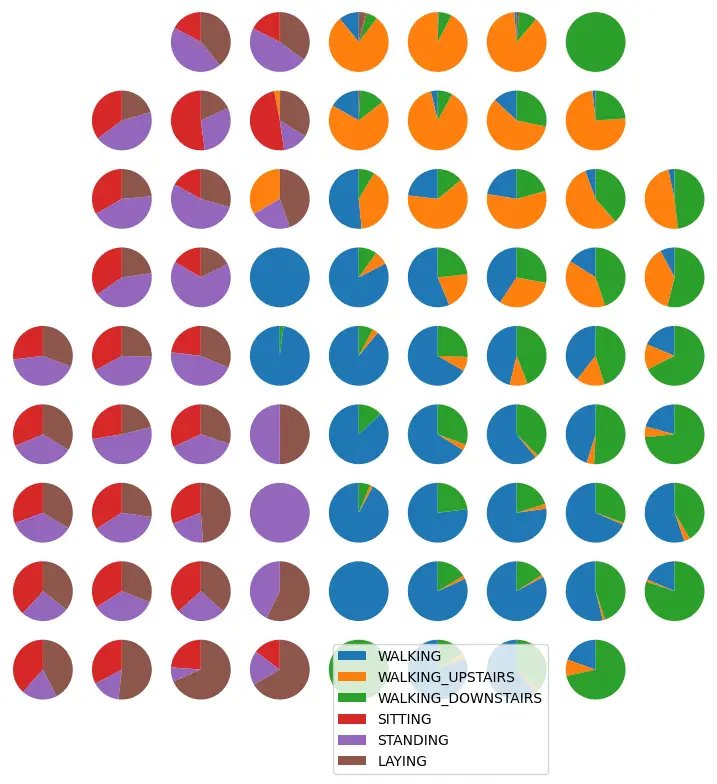
Self-Organizing Maps (SOM)
SOM projects high-dimensional data onto a 2D neural grid while preserving topological relationships. This makes it useful for exploratory structure analysis, especially in HAR-like settings.
The project examines U-Matrix structure, activation maps, label purity per neuron, and training curves to understand where SOM captures meaningful organization and where activity classes remain mixed.
Dataset Results: Mall Customers
Mall Customers is a low-dimensional segmentation problem where cluster structure is comparatively clear. K-Means with around five clusters produces compact and readable groups, while Ward linkage provides similarly coherent partitions.
DBSCAN can achieve high quality under specific parameter settings, but sensitivity to eps and min_samples means stability depends on careful tuning. View Mall Customers Notebook.
Dataset Results: Forest Type
Forest Type has 27 numerical variables and benefits from PCA for visualization and clustering. Even after projection, overlap remains non-trivial.
K-Means and Ward are generally the most practical methods here: they provide usable segmentation despite moderate silhouette values. DBSCAN is less effective due to relatively uniform density, which reduces its ability to identify meaningful dense-core regions. View Forest Type Notebook.
Dataset Results: Human Activity Recognition (HAR)
HAR is high-dimensional and challenging, with substantial overlap between activities after PCA projection. K-Means shows that low-k solutions can maximize silhouette while still mixing classes.
Hierarchical methods indicate Ward as the most reliable interpretable option, while Single linkage often inflates scores through chaining artifacts. SOM adds valuable topological insight through U-Matrix and neuron-level label composition. View Human Activity Recognition Notebook.
Cross-dataset comparison takeaways
- No single clustering method dominates across all datasets and geometries.
- K-Means is a strong baseline when clusters are compact and approximately convex.
- Ward linkage is the most consistently interpretable hierarchical variant in this comparison.
- DBSCAN is powerful for density-defined structure but highly sensitive to hyperparameters.
- PCA is critical for tractable analysis and visualization in high-dimensional settings.
- SOM complements metric-based evaluation with topology-aware exploratory insights.
Suggested next improvements
- Add automated hyperparameter sweeps with consistent evaluation protocol across all methods.
- Extend comparison with Gaussian Mixture Models and spectral clustering baselines.
- Include stability analysis under bootstrap resampling to measure segmentation robustness.
- Add richer visual diagnostics and confusion-style alignment with known labels when available.
Interesting Papers
- Silhouettes: A graphical aid to the interpretation and validation of cluster analysis (Rousseeuw, 1987)
- A Density-Based Algorithm for Discovering Clusters in Large Spatial Databases with Noise (Ester et al., 1996 - Original DBSCAN Paper)
- Self-Organized Formation of Topologically Correct Feature Maps (Kohonen, 1982 - Original SOM Paper)
- Data clustering: 50 years beyond K-means (Jain, 2010)
- A Comprehensive Survey of Clustering Algorithms (Xu & Tian, 2015)
- HDBSCAN: Hierarchical density based clustering (McInnes, Healy & Astels, 2017)
- UMAP: Uniform Manifold Approximation and Projection for Dimension Reduction (McInnes et al., 2018)
- A Survey of Clustering With Deep Learning (Min et al., 2018)