Kubernetes GitOps Platform: From Docker Compose to a Self-Operating Cluster
This project builds a production-style Kubernetes platform from scratch, one layer at a time. At its centre is a deliberately small application, a todo app with a React frontend served by Caddy, an Express/TypeScript API and PostgreSQL. The app barely changes; what grows around it is the platform: packaging, secrets, storage, routing, identity, a private registry, GitOps delivery and observability.
The end result is a k3s cluster that is a function of its Git repository: infrastructure, platform services, monitoring and the application are all declared in Git and continuously reconciled by Flux. Deploying is a commit, rolling back is a revert, and a lost cluster can be rebuilt from the repository.
The repository doubles as a learning path: every step comes with theory, guided exercises and a working solution, so anyone can learn Kubernetes by following real examples instead of isolated snippets.
1. The Final Platform
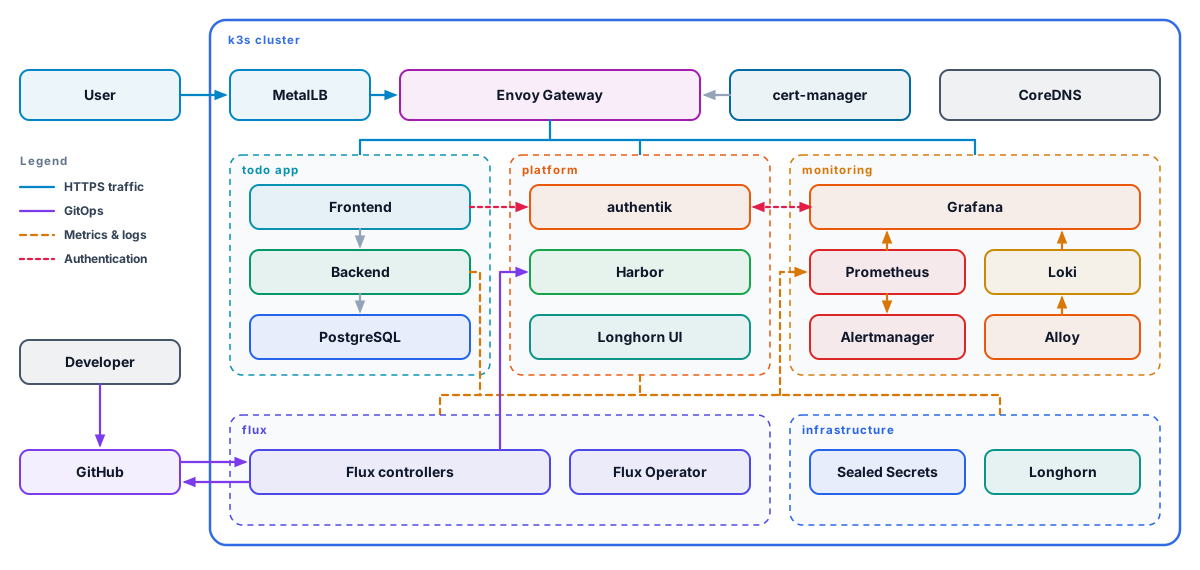
The platform is organised in five groups: the edge (MetalLB, Envoy Gateway, cert-manager, CoreDNS) that brings HTTPS traffic in, the application namespace, the platform services (authentik, Harbor, Longhorn UI), the monitoring stack, and the GitOps and infrastructure controllers that hold everything together.
2. The Stack at a Glance
| Concern | Tool | Role in the platform |
|---|---|---|
| Orchestration | Kubernetes (k3s) | Runs every workload on a lightweight distribution that behaves like a real multi-node cluster. |
| Packaging | Helm | Installs the app and every third-party component as versioned, configurable charts. |
| Composition | Kustomize | Combines a shared base with per-environment overlays, without copy-pasted YAML. |
| Delivery | Flux CD | GitOps: the cluster pulls its desired state from Git and corrects any drift. |
| Secrets | Sealed Secrets | Encrypts secrets so they can be committed to a public repository. |
| Storage | Longhorn | Replicated block volumes that survive node restarts and rescheduling. |
| Networking | MetalLB, Envoy Gateway, cert-manager | A LoadBalancer IP, Gateway API routing by hostname, and TLS from an internal CA. |
| Identity | authentik | Single sign-on for every UI, including apps that have no login of their own. |
| Registry | Harbor | Private storage for container images and Helm charts. |
| Observability | Prometheus, Loki, Alloy, Grafana | Metrics, logs, alerts and dashboards for both the platform and the application. |
3. How It Was Built
- Docker Compose: understand the application, container networking, environment variables and persistence.
- Plain Kubernetes: move the app to Pods, Deployments, Services, ConfigMaps, Secrets and PersistentVolumeClaims.
- Helm: replace static manifests with a templated, versioned chart.
- Secrets and storage: Sealed Secrets for credentials in Git, Longhorn for durable, replicated volumes.
- Traffic and identity: HTTPS on real hostnames with Envoy Gateway and cert-manager, SSO with authentik.
- Private registry: images and charts pushed to Harbor instead of public registries.
- GitOps: every manual
helm installreplaced by Flux reconciling the repository. - Observability: metrics, logs and alerts for everything running in the cluster.
4. Helm: Packaging Everything
The todo app is packaged as its own Helm chart: frontend, backend, PostgreSQL, its HTTP route, the authentication policy and an optional Prometheus monitor, all driven by values. The chart is versioned with semver and published to Harbor as an OCI artifact, exactly like the container images.
Every third-party component (cert-manager, Longhorn, Envoy Gateway, authentik, Harbor, kube-prometheus-stack, Loki...) is an upstream chart pinned to an exact version. At first they were installed by a script in a carefully chosen order; with GitOps each one becomes a HelmRelease: a Helm release whose install, upgrade, retries, rollback and drift detection are owned by a controller instead of a terminal.
5. Kustomize: Composing Without Duplicating
- Base and overlays: the application's environment-independent configuration lives in a base; each cluster only patches what differs (image tags, replicas, chart version). A staging environment is just one more overlay.
- Generated resources: Grafana dashboards are kept as plain JSON and turned into ConfigMaps by a generator, so a dashboard change is a readable diff in a pull request.
- Flux Kustomizations on top: Flux adds its own
Kustomizationresource, which answers when to apply a directory, after what, and how to verify it, and injects cluster-specific values (Gateway IP, MetalLB range) from a single settings ConfigMap.
6. GitOps with Flux
Instead of a pipeline pushing changes into the cluster with admin credentials, Flux runs inside the cluster and pulls the repository. It continuously compares Git with reality, applies the difference, prunes what was deleted and reverts manual changes. Flux itself is installed by the Flux Operator, so upgrading Flux is also just a commit.
The startup order of the platform is not a script anymore, it is a dependency graph stored as data. Each layer waits for the ones it needs and only reports Ready when everything inside it is healthy:
Flux Layers
Controllers and their CRDs come first, then the resources that use them. Secrets get their own layer so they exist before the services that read them. Monitoring is a branch, not a step: nothing depends on it, so a broken Grafana never blocks a new release. Observability should watch the platform, not gate it.
apiVersion: kustomize.toolkit.fluxcd.io/v1
kind: Kustomization
metadata:
  name: monitoring
  namespace: flux-system
spec:
  dependsOn:
    - name: infra-configs      # Gateway, CA issuer, storage
    - name: platform-secrets   # Grafana's OIDC secret
  interval: 1h
  sourceRef:
    kind: GitRepository
    name: flux-system
  path: ./monitoring
  prune: true                  # deleted from Git = deleted from the cluster
  wait: true                   # Ready only when everything inside is healthy
Image Automation Loop
New releases close the loop without bypassing Git. When a new image or chart version lands in Harbor, Flux picks the newest semver tag, commits it to the repository, and the normal reconciliation deploys that commit. The history of every deployment stays in Git, and a bad release is undone with git revert.
7. Anatomy of a Request
- The browser resolves
todo.localto the Gateway IP that MetalLB announces on the local network. - Envoy Gateway terminates TLS with a certificate issued by cert-manager and matches the route by hostname.
- A security policy asks authentik whether the user is logged in (forward-auth); if not, the user is sent to the login page.
- The frontend serves the React app and proxies API calls to the backend, which reads and writes PostgreSQL on a replicated Longhorn volume.
- The request leaves a metric in Prometheus and a structured log line in Loki, both visible on the same Grafana dashboard.
8. Secrets, Identity and Trust
- Sealed Secrets: credentials are encrypted with the cluster's public key and committed; only the controller can decrypt them. Its private key is the one secret kept outside Git, backed up and restored on every rebuild.
- authentik: forward-auth protects apps without a login (the todo app, the Longhorn UI), while Grafana uses OIDC with roles mapped from authentik groups. Its configuration is declared as blueprints.
- Internal CA: cert-manager issues every certificate from a homelab CA, and in-cluster DNS resolves the platform hostnames so Pods reach each other through the same HTTPS endpoints as users.
9. Observability
- Metrics: the Prometheus Operator turns scrape configuration into Kubernetes objects, so every component ships its own monitor. The backend is instrumented with request rate, errors and latency (RED).
- Logs: Alloy runs on every node and ships container logs to Loki; the backend writes structured JSON, so logs and metrics share the same labels.
- Alerts: the default kube-prometheus rules evaluate cluster health and route firing alerts through Alertmanager.
- Grafana as code: datasources and dashboards come from Git, and users log in through authentik.
10. Key Design Decisions
- Pull, not push: no pipeline holds cluster credentials; the cluster fetches its own state.
- Everything pinned: Flux and every chart use exact versions, so two rebuilds a month apart run the same software.
- Dependencies as data: ordering lives in
dependsOn, not in the line order of a shell script. - Observability beside, not in front: a failing monitoring stack never stops application deliveries.
- Logs are data: low-cardinality labels and no secrets in log lines, because centralised logs are readable by everyone with dashboard access.
Further Reading
| Resource | Use it to... |
|---|---|
| OpenGitOps Principles | Understand the four principles (declarative, versioned, pulled automatically, continuously reconciled) the whole platform is built on. |
| Flux: Ways of Structuring Your Repositories | Compare monorepo, repo-per-team and repo-per-app layouts, and how clusters, infrastructure and apps are split. |
| flux2-kustomize-helm-example | Study the official reference layout of infrastructure and apps layers that this platform follows. |
| Helm: Use OCI-based Registries | Learn how charts are pushed to and pulled from a registry like Harbor, just like container images. |
| Gateway API Concepts | Learn the role-oriented routing model (GatewayClass, Gateway, HTTPRoute) that replaces Ingress. |
| Kubernetes Secrets Management: Vault vs Sealed Secrets vs External Secrets | Compare the main ways to keep secrets safe in a Git-driven cluster and when each one fits. |
| Google SRE Book: Monitoring Distributed Systems | Ground the observability design in the four golden signals and symptom-based alerting. |
| The RED Method | Decide which metrics each service should expose and how to build dashboards around them. |
| The Twelve-Factor App | Apply the principles (config in the environment, stateless processes, logs as streams) that make an app fit this kind of platform. |